medium
City of Barcelona: web AR interactive touristic map
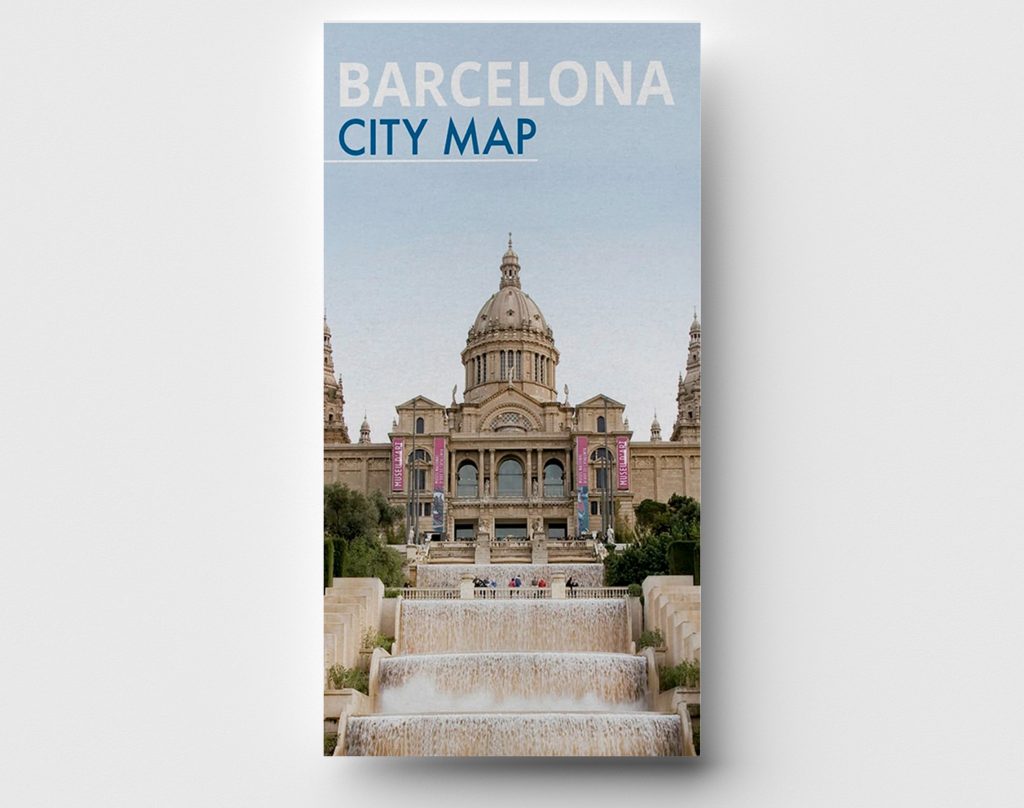
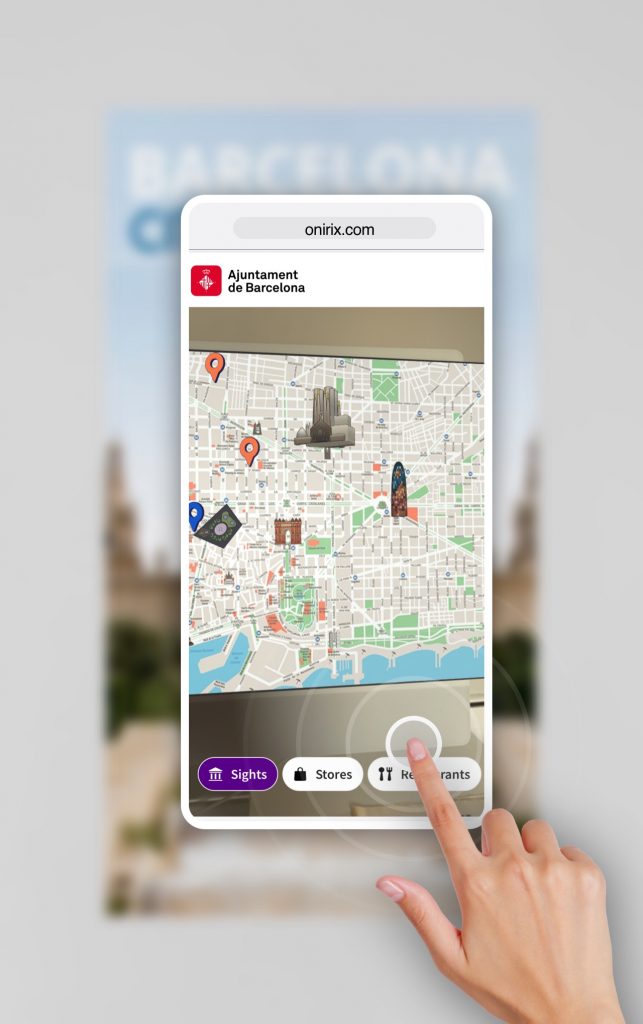
In this experience you can see how a tourist map of Barcelona comes to life, starting from the typical paper map, or the maps placed in the tourist offices. The experience starts from the physical image of these maps, and shows different areas of the city: points of interest, restaurants, stores.


Experience overview 📖
This is a typical case of tourism or cultural experience, but it can be very much aligned with the retail and consumer sector. In this map of Barcelona you can offer two types of services to tourists and visitors: quality information about the city, and information about sponsored or relevant establishments.
The experience is based on the animation of the city map, and the display of some relevant points in 3D. Other points of interest such as restaurants and hotels are also highlighted, which the user can filter to keep only the most valuable information.
Visualize this experience
Scan the QR code and hold your device pointing to the image to view in AR


Visualize this experience
Scan code and to view in AR


Uses and benefits 🌱
If you are a creative agency and your clients are in the restaurant and hospitality industry; or on the other hand, if you have access to institutional clients or municipalities, tourism and information agencies, this type of experience is of interest to you.
You can design an experience that expands the level of communication with tourists and with your current map and brochure designs. Any type of graphic element can be susceptible to expand its content in this virtual and augmented dimension.
Features and tips💡
The following Onirix capabilities have been used for this experience:
3D models and animations.
In Onirix it is possible to add different types of resources or Assets to the scenes. One of the most used in this type of experience are 3D models. With this Asset format you can add elements that include animations, which can be activated at different times within the Onirix scene editor, and therefore, use these animations to tell stories.
In the case of this experience there is a 3D model of the map of Barcelona that opens, and several 3D models of some of the most representative points of the city.
For more information see our documentation on 3D models in Onirix.
Content cards
All the points of interest on the map have relevant information that can be consumed through the content tabs. Both the cultural points of interest as well as the different restaurants and stores in the example.
More information about content cards.
Code editor: HTML, CSS and JavaScript. Embed SDK.
Through the code editor and the Embed SDK some functionalities have been added to the experience. On the one hand, elements have been included in the interface, and styles for the different parts. On the other hand, some logic has been included, mainly showing and hiding elements depending on the user’s selection (embedSDK.disable, embedSDK.enable events).
Here to access the online documentation of the code editor.
Here to access the Embed SDK documentation.
Scene image tracking
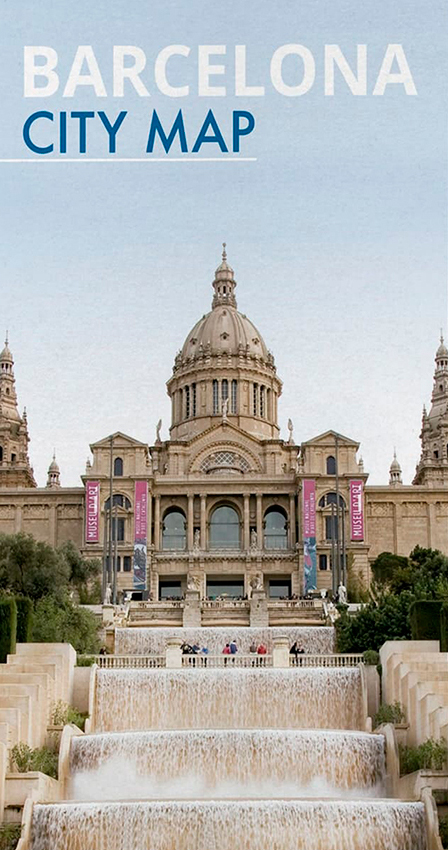
In this example the Barcelona map cover acts as a marker. It is the map itself that comes to life to show us the information hidden in the experience.
Access the documentation on image-tracking scenes here.
